Historically, there is a high correlation between 30 year U.S. treasuries and 30 year mortgage rates (Chart 1). The chart shows that the 30 year treasury yield has spiked upwards starting in 2013, so I expect that the 30 year mortgage rates will spike upwards too. 30 year mortgage rates have already gone up from 3% to 4.9%, which had negative consequences for the real estate market, which is not priced in yet in the housing index.
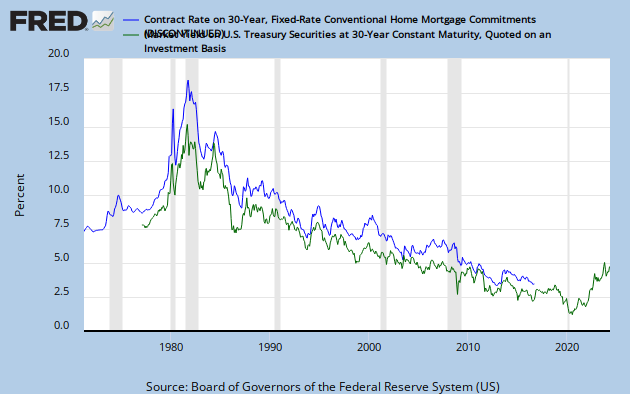 |
| Chart 1: Correlation between 30 year treasury yield and 30 year mortgage yield |
As Zero Hedge reports, the affordability of housing is declining rapidly with rising mortgage yields. Every percentage increase in yields on 30 year mortgages will result in a 10% decline in affordability as the chart shows. If yields continue to go up to 6%, affordability would have declined about 40% since 2013.
 |
| Chart 2: House Purchasing Power |
The answer is that real estate should be sold out of. Kyle Bass for example sold out of three of his real estate holdings: Newcastle Investment Corp (NCT), Hyatt Hotels Corporation (H) and Realogy Holdings Corp. (RLG ) - Real Estate Services.
=> Read it here.
Geen opmerkingen:
Een reactie posten